Mann Whitney U test calculator (Wilcoxon rank-sum)
Non-parametric test
The test compares the probability to get higher value from group1 with the probability to get higher value from group2.
Test calculation
Enter sample data
Header: You may change groups' name to the real names.
Data: When entering data, press Enter, , or Space after each value.
Enter sample data
You may copy data from Excel, Google sheets or any tool that separate data with Tab and Line Feed.
Copy the data, one block of 3 consecutive columns includes the header, and paste below.
Copy the data, one block of 3 consecutive columns includes the header, and paste below.
Copy the data,

It is okay to leave empty cells, empty cells or non numeric cells won't be counted
Results
validation message
Information
Hypotheses
H0: Group1 ≥ = ≤ Group2
H1: Group1 < ≠ > Group2
Test statistic

Normal distribution
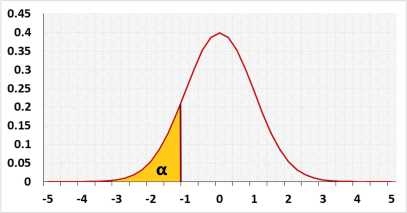
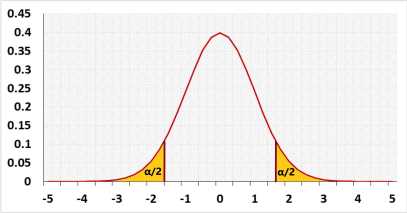

Target
Unlike t-test that compares the means, the Mann-Whitney U test compares a randomly selected value from group1 to a randomly selected value from group2.When the two distributions have a similar shape you can use the test to compare also the medians.
When the two distributions have a similar symmetrical shape, you can use the test to compare also the means. more
Method
The mann whitney u test calculator may use three methods. We reccomend to use the "Automatic" method.Automatic - when n1≤20 and n2≤20 and the data doesn't have ties, the tool uses the exact value, otherwise the tool uses the z approximation.
Exact - when n1≤20 and n2≤20 the tool uses the exact value, calculated base on all the possible combinations, otherwise the tool uses the z approximation.
Z approximation - the tool uses the z approximation.
Continuity correction - relevant only for the Z approximation. It is used since a continuous distribution is used to calculate a discrete distribution.
R Code
The following R code should produce similar results: