Test calculation
The calculator includes results from the Fisher calculator, binomial test, McNemar Mid-p, simulation.
Enter raw data from excel
McNemar chi-square test
Matched pairs
Enter sample data
Enter sample data
You may copy data from Excel, Google sheets or any tool that separate data with Tab and Line Feed.
Copy the data, one block of 3 consecutive columns includes the top header row and left header column, and paste below. example

It is okay to leave empty cells, empty cells or non numeric cells won't be counted
The sum of the expected values must be equal to the sum of the observed frequencies or to one.

Results
| k | Number of categories | |
| n | Sample size | |
| χ² | Chi square test statistic | |
| DF | ||
| Phi effect (Φ) | Φ=√(χ2/n) |
Information

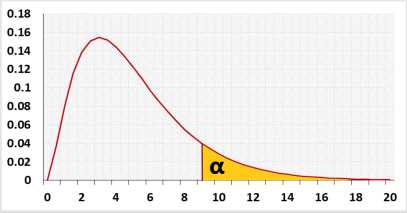
Target: Check if the statistical model fits the observations.
The test uses Chi-square distribution.
McNemar chi-square test
The test checks only the cases when the status of the dichotomous variable was changed.
The null assumption is that the probability to switch from A to B equals the probability to switch from B to A, equals 0.5.
| Before \ After | A | B |
| A | No change | A to B |
| B | B to A | No change |
Chi-square test for independence
The null assumption is that the two categorical variables are independent.
R Code
The following R code should produce the same results:
Goodness of fit example: checking a fair dice.
Model: the probability of each side is equal - 1/6.
H0: fair dice.
H1: unfair dice.
The groups are the dice's numbers (1,2,3,4,5,6).
In this example, you throw the dice n times.
Expected frequencies - for each group are n/6.
Observed frequencies - the actual times each number appears.