Kaplan Meier Survival Analysis
The survival analysis calculator, Kaplan-Meier online, and log-rank test calculator generate the Kaplan-Meier plot, cumulative incidence plot, and calculate the log-rank test.

Information
The Kaplan–Meier method is a non parametric method used for the survival analysis. The survival probability calculator generates the Kaplan-Meier curve with confidence interval and calculates the Log-Rank test for more than of two groups.
Event of interest (Dt): Maintenance failure, recovery, disease occurrence, death, etc.
Censored event (Ct): the event of interest didn't happen since the subject left the experiment before the ending time, or due to the termination of the experiment.
nt: number of participants that didn't have an event yet (event of interest or censored event).
Proportion surviving interval (Pt): the proportion of survival participants between period t-1 and period t.
Survival rate (St / Cumulative Survival/ Survival function): the proportion of survival participants from period 0 to period t.
Sum = ΣDt/nt(nt - Dt)
S.Et: the standard deviation of the survival rate. S.E = St√(Sum)
Lowert: Lower bound of St confidence interval .
Uppert: Upper bound of St confidence interval.
Chart type
Line –Survival rate (St) per time.
Confidence interval – added the Confidence interval areas to the line, with confidence level of (1 - α).
S.E area – present St ± 1*S.E, the S.E is the area below and above the line.
S.E error bars – present St ± 1*S.E, the S.E is presented as error bar.
Log rank test calculator
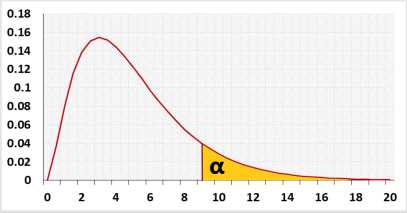
Target: test the null assumption that the "time to event" distribution is identical for all the groups.The test uses the chi-square distribution.
The log-rank test model assumes the events per subject distributes evenly between the groups. The expected number of events is calculated per each time value.
Example with two groups A and B.
Expected value = nA(dA + dB)/(nA + nB)
The page was created per Anna P request.