Each time you enter a "number of items" on the chart, the calculator computes every region it can derive and shows it in blue.
If you like the page, please share or like it. Questions, comments and suggestions are appreciated and can be sent to [email protected].
Solution
Venn diagram online
The interactive Venn diagram calculator and problem solver allows you to easily solve problems with two or three circles. Enter the number of items for each group or intersection, and the calculator will derive the remaining regions. Alternatively, switch the input field to 'Data list': enter the list of items for each group, and the calculator will compute the intersections and draw the Venn diagram.
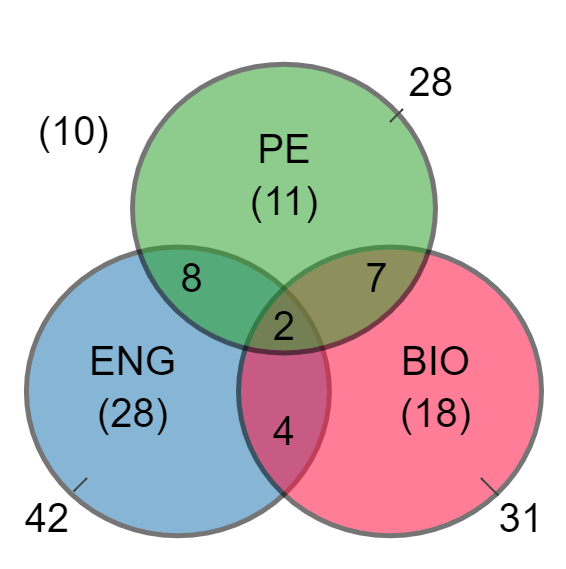
Venn diagram example
In this example each student can learn one or more of the following subjects: Science, Physical education, and History.
Press the 'Sample totals' button to load the quantities of items in the groups and intersections — the calculator immediately derives every remaining region and draws the diagram.
Press the 'Sample data' button to load a list of items for every group — the calculator computes all the intersections.
How to use the venn diagram calculator
Click any label on the chart to open a small input box next to it. Enter the value and press Enter. To leave a group name or intersection label empty, simply fill in a space. To add a new line to a label, press Enter after the first line and continue on the second line. The diagram updates automatically after every entry.
1. Number of data items
- Click a region on the chart and enter the number of items in that group or intersection.
- For each group you can enter two kinds of numbers:
- A: the number of objects in the group, including its intersections.
- A-Only: the number of objects belonging exclusively to this group.
- Each time you enter a number, the calculator checks whether it can derive the number of items in any connected group or intersection from the numbers you have already entered.
- Derived numbers are shown in blue, and the calculation steps appear in the "Solution" section.
- If the numbers you enter contradict each other, the calculator shows a warning naming the inconsistent regions.
- The calculator can derive a value whenever only one value is missing from a known relationship.
2. Data list
- Click a group label (A, B, C) and enter the list of items for that group, separated by commas.
- The calculator computes all the intersections.
- In this mode the "Output" field appears, with three options:
- Number of data items: shows the quantity in each region.
- Data list: shows the items in each region.
- Item quantity and data list: shows both.
Fields
- Title / Subtitle - the chart title and font size.
- Input - Number of data items or Data list.
- Output - relevant only for the data list: count, list, or both.
- Group - click a group label to rename it and choose the circle color.
- Number of groups - two or three circles.
- Background - the color of the diagram area.
- Border width - the circle border; fill zero for no border.
- Border Color - Darker (same color as the circle, darker; set the darker level 0-100) or One color of your choice.
- Opacity - the circles' fill opacity.
- Font / Data Font - font type, size and color for labels and data.
- Download - hover over the diagram and use the buttons at its top-right corner to download it as PNG/JPG (per the Format setting) or SVG.
- Move circles / labels - the buttons beside the chart control the circle overlap and the label distance.
- Remove intersections' labels - show only the numbers for the intersections.
- Remove mutually exclusive intersections - hide labels of intersections that do not overlap.
- Remove 'no group' label - hide the 'No group' label.
How to solve a Venn diagram problem
When the problem contains numbers of items
- Read the question.
- For each number, determine the relevant group or intersection.
- Rename the labels as needed (click a label on the chart).
- If the number covers the entire group, enter it in the group's "All" box.
- If the number excludes the intersections, enter it in the "Only" box.
- After every entry the calculator derives the values it can and shows them in blue, with a step-by-step solution in the Solution section.
When the problem contains data lists
- Read the question.
- Switch the Input field to 'Data list'.
- Click each group label and enter a comma-delimited list of its items.
- Choose the output: number, list, or both.
- The calculator computes all the intersection lists and draws the Venn diagram.