Friedman Test Calculator
Within-subjects design, the same subjects show up in each group, or exposed to every treatment.
The tool ignores empty cells or non-numeric cells.

Friedman Test Calculator
The friedman test is the equivalent nonparametric test to the one-way repeated measures ANOVA.
The friedman test checks if the difference between the ranks of two or more dependent groups is significant.
While on Kruskal Wallis test each subject appears only in one group, on the friedman test each subject appears in every group. A friedman test contains only one categorical variable, each group/treatment is one value of the categorical variable.
The signed test yields similar results to the Friedman test with two treatments. However, the results are not exactly the same, as the two tests handle ties differently. The Friedman test is a bit more conservative. The Friedman test is distinct from the Wilcoxon test as it doesn't consider the magnitude of differences within the subjects
Targets
The Friedman test test checks if the difference between the ranks of two or more dependent groups/treatments is significant when every subject appears in each group.
When performing the Friedman test test, we try to determine if the difference between the ranks reflects a real difference between the groups, or is due to the random noise inside each group.Unlike many other statistic tests, the smaller the statistic the more likely the averages are equal.
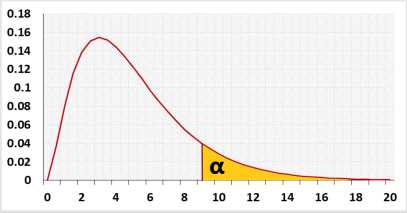
Right-tailed Chi-squared test, for the Friedman test you can use only the right tail. Why?
n - number of subjects.
k - number of treatments/groups.
df = k - 1.
Ties correction
gi - number of ties groups in subject i.u - ties group number. u =1..gi
ti,u - number of equal values in group u of subject i.
How to use the Friedman test calculator?
- Significance level (α): A p-value less than the significance level is statistically significant.
Researchers usually use 0.05, but if the price of a mistake is big, they may use a smaller value like 0.01. - Outliers: extreme values, the calculator uses Tukey's Fences method with k=1.5 to identify the outliers based on the residuals.
for other methods, you may use the outlier calculator.
The calculator only identifies the outlier but doesn't exclude it. you should exclude outliers only if you identify them as error data. - Advanced fields - for sample size
When planning the experiment, you should choose the effect size that the test should identify. You should choose the sample size before conducting the research. We added this field to alert users that didn't calculate the sample size or did it incorrectly.
If you use the calculator for homework you may ignore these fields.
Effect - If you don't know the required effect size, you may use the 'effect' field. The default is 'Medium', if you change the value, it will change 'effect type' to 'Standardized effect size' and fill the proper value per Cohen's suggestion in the 'effect size' field. (0.2: Small, 0.5: medium, 0.8: large) The calculator will not use this field when pressing the 'calculate' button.
Effect type
f - effect size.
f2 - effect size.
η2 - ETA squared = SSB / (SSB + SSE)
Effect size - the value that you want the test to be able to identify. You need a larger sample size to be able to identify a smaller effect size. - Rounding - how to round the results?
When a resulting value is larger than one, the tool rounds it, but when a resulting value is less than one the tool displays the significant figures. - How to enter data?
Enter data in a table - enter one value in each cell.
Enter data in columns - each column is one group or treatment.
The order in the column represents the subject, for example, the second value in each column represents subject #2.
Enter data from excel - copy the raw data with the group header and without the subjects left column, and paste in the calculator. you may copy from Excel or Google sheets, or any tool that separates data with tab and line feed. copy the entire block, and include the header.
Assumptions
- The dependent variable is continuous (ratio or interval)
- One categorical independent variable
- Each subject appears in each group/treatment
- The dependent variable is ordinal or continuous.
Required Sample Data
Sample data from all compared groups
Friedman test calculation
- Rank the values for each subject (row).
- Sum the square ranks for each treatment/group.
- If ties exist, calculate the ties correction.
- Calculate the statistic and the degrees of freedom.
- Calculate the p-value.
Example: Compare the blood pressure results over time by examining each subject's blood pressure before treatment, after one week, and after two weeks. The measurements are taken at three points: before treatment, after one week, and after two weeks. Multiple measures are collected for each subject, including data for each treatment.
Post hoc - Nemenyi test
As a post-hoc test for multiple comparisons, we employ the Nemenyi test. This test utilizes the Studentized range distribution to correct the increased type I error that may result from multiple tests.