Paired T Test Calculator (Dependent T test)
The paired t-test calculator calculates the paired t-test p-value. When you enter raw data, the paired t-test calculator also calculates the Shapiro-Wilk normality test and calculates the outliers.
The paired t-test calculator doesn't count empty cells or non-numeric cells.

Paired t-test online
What is a paired t-test?
The paired t-test calculator also called the dependent t-test calculator compares the means of the same items in two different conditions or any others connection between the two samples when there is a one to one connection between the samples - each value in one group is connected to one value in the other group. The test uses the t distribution. more
How to use the paired t-test calculator?
How to enter data?
- Enter raw data directly - enter the raw data separately for each column. You may copy from excel, or enter one by one separate with comma or enter.
- Enter raw data from excel - copy the entire block
- Enter summarized data - Enter the aggregated data: the averages of the differences, the number of pairs and the standard deviation of the differences.
When planning the experiment, you should choose the effect size that the test should identify.
If you don't know the required effect size, you may choose the effect, and the tool will fill an appropriate value in the effect size field.
The importance of the effect size is in the sample size selection. If the observed effect size is smaller than this value, you may not get a significant result.
Effect Type
- Mean difference (Unstandardized effect size) the value in 'Effect size' is the average of the differences between the paired data.
- Cohen's d - (Standardized effect size) - the value in 'Effect size' is the difference between the means divided by the standard deviation.
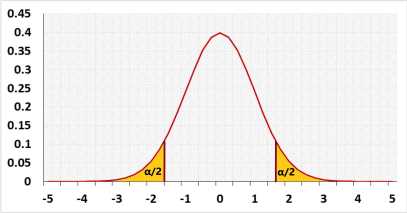
Two-tailed paired t-test example:
forty people are given treatment to reduce their cholesterol levels, with an expected reduction of 10mg/dL. The distribution of the reduction is symmetrical but not normal, and the researcher takes two measures for each person before and after the treatment.
The average reduction in cholesterol level is 12mg/dL (x̄d = 12mg/dL, n = 50), with a standard deviation of 2.2mg/dL (Sd = 2.2mg/dL). The hypothesized mean is μ0 = 10mg/dL. In this case, the researcher would like to know if μ0 is correct. Both higher and lower reductions are of interest.
Right-tailed paired t-test example.
Does the treatment for pattern hair loss effective?
Measurement: hair density (hairs per square cm).
Check the same person before and after six months of treatment.
H0: the results before and after the treatment are identical.
H1: higher hair density after the treatment.