One Sample T Test Calculator
The one-sample t-test determines if the mean of a single sample is significantly different from a known population mean.

The one sample t-test calculator calculates the one sample t-test p-value and the effect size. When you enter the raw data, the one sample t-test calculator provides also the Shapiro-Wilk normality test result and the outliers.
One sample t-test
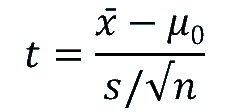
The one sample t test formula, is similar to the z score formula, but instead of population standard deviation it uses the sample standard deviation (S), and since the statistic is average, it divides S by √n.
What is a one sample t-test?
The one sample t-test, also called single sample t-test, compares the sample mean to the population mean.
more
How to use the one sample t test calculator?
- Choose the tails:
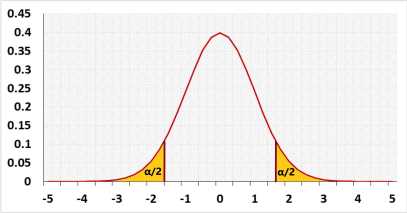
The one-tailed test, left or right, is more powerful than the two-tailed test and results in a smaller p-value, half since the t distribution is symmetrical. You should choose it if only one direction is interesting, but the question of when to use the one-tailed test is controversial.
Two - the alternative hypothesis states that the population's mean is either smaller or bigger than the expected mean.
Left - the alternative hypothesis states that the population's mean is smaller than the expected mean.
Right - the alternative hypothesis states that the population's mean is bigger than the expected mean. - Significance level (α): A p-value less than the significance level is statistically significant.
Researchers usually use 0.05, but if the price of a mistake is big, they may use a smaller value like 0.01. - Outliers: extreme values. relevant only if you entered raw data.
included - the calculator will calculate the outliers but will include them in the calculation.
Excluded - The calculator will exclude the outliers before calculating the average and the standard deviation. - Advanced fields - for sample size
When planning the experiment, you should choose the effect size that the test should identify. You should choose the sample size before conducting the research. We added this field to alert users that didn't calculate the sample size, or did it incorrectly.
If you use the calculator for homework you may ignore these fields.
Effect - If you don't know the required effect size, you may use the 'effect' field. The default is 'Medium', if you change the value, it will change 'effect type' to 'Standardized effect size' and fill the proper value per Cohen's suggestion in the 'effect size' field. (0.2: Small, 0.5: medium, 0.8: large) The calculator will not use this field when pressing the 'calculate' button.
Effect type
'Standardized effect size' (Cohen's d) - the value in 'Effect size' is the difference between the sample mean and the expected mean divided by the standard deviation.
'UnStandardized effect size' - the value in 'Effect size' is the difference between the sample mean and the expected mean.
Effect size - the value that you want the test to be able to identify. You need a larger sample size to be able to identify a smaller effect size. - Expected mean - this is the null assumption value.
- Rounding - how to round the results?
When a resulting value is larger than one, the tool rounds it, but when a resulting value is less than one the tool displays the significant figures. - How to enter data?
Enter summarized data: Average (x̄), SD, n - use this option if you already have the sample measures (Usually homework).
a. Enter the name of the group instead of "Group-1", this is not mandatory.
b. Enter the sample average.
c. Enter the sample standard deviation.
d. Enter the sample size (n).
Enter raw data directly - usually you have the raw data.
a. Enter the name of the group.
b. Enter the raw data separated by 'comma', 'space', or 'enter'. (*you may copy only the data from excel)
Enter raw data from excel - copy the raw data with the header from Excel or Google sheets, or any tool that separates data with tab and line feed. copy the entire block, include the header .
*When having only one column like in one sample t-test calculator the difference between the last two options is minor, but we prefer to use the same format along with the website.
The one sample t-test calculator ignores empty cells and non numeric cells.
Examples
Two-tailed one-sample t test example:
A farmer calculated last year the average of the apples' weight in his apple orchard μ0 equals 90 grams, based on the entire population.
The current year he checked a small sample of apples and the sample average x̄ equals 82 kg
Has the average of the apple's weight changed this year?
Both changes are interesting, if the average is larger than expected or if it is lower.
The farmer doesn't care if the change in the average is less than 1 gram. H0: the average apple's weight is the same as last year (90 grams).
H1: the average apple's weight is not the same as last year, larger or smaller.
When calculating the required sample size you should use 1 gram Unstandardized effect size.
Left-tailed one-sample t test example.
In the same example as above, the farmer only cares to know if the entire average is lesser this year.
H0: the average apple's weight is the same as last year (90 grams), or larger.
H1: the average apple's weight smaller than last year.